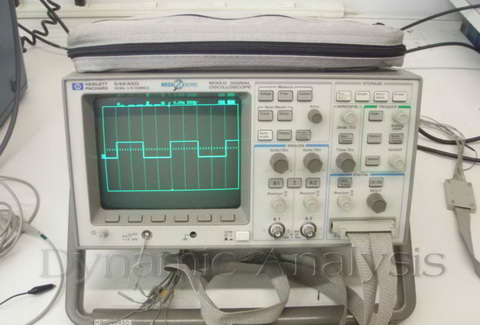
The Agilent Technologies Inc. 54645D oscilloscope is a graph-displaying device – it draws a graph of an electrical signal. In most applications, the graph shows how signals change over time: the vertical (Y) axis represents voltage and the horizontal (X) axis represents time. The intensity or brightness of the display is sometimes called the Z axis.
The Agilent Technologies Inc. 54645D oscilloscopes simple graph can tell you many things about a signal, such as: the time and voltage values of a signal, the frequency of an oscillating signal, the “moving parts” of a circuit represented by the signal, the frequency with which a particular portion of the signal is occurring relative to, other portions, whether or not a malfunctioning component is distorting the signal, how much of a signal is direct current (DC) or alternating current (AC) and how much of the signal is noise and whether the noise is changing with time.
The Agilent Technologies Inc. 54645D oscilloscopes simple graph can tell you many things about a signal, such as: the time and voltage values of a signal, the frequency of an oscillating signal, the “moving parts” of a circuit represented by the signal, the frequency with which a particular portion of the signal is occurring relative to, other portions, whether or not a malfunctioning component is distorting the signal, how much of a signal is direct current (DC) or alternating current (AC) and how much of the signal is noise and whether the noise is changing with time.
Main Products
Analyzers,Diagnostic Tools,Fucion Splicers,Level Meter,Opthalmoscopes
